The SWOT mission – infographic

Description
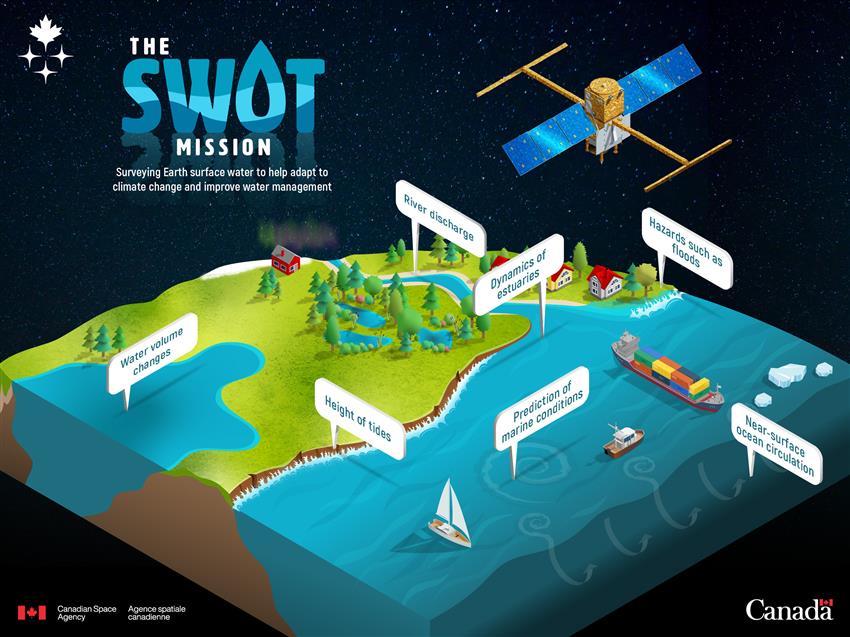
Infographic presenting elements to be studied by Canadian scientists with SWOT mission data.
- Estimate changes in water volume of lakes, reservoirs and wetlands and in river flows.
- Understand water-related hazards such as floods.
- Understand the dynamics of estuaries.
- Measure sea level changes to understand ocean circulation, a critical process linked to climate change.
- Better map coastal regions and determine the height of tides.
- Better predict marine conditions, including storm surges and ocean currents, which are important for navigation, fisheries and offshore commercial operations.
*The SWOT mission is led by NASA and France's space agency (CNES) in collaboration with the Canadian Space Agency and the United Kingdom Space Agency. (Credit: Canadian Space Agency)
Text version
Isometric infographic showing a small portion of Earth with space in the background and the SWOT satellite in orbit. It features visual elements that represent what Canadian scientists are studying as part of SWOT mission: oceans, rivers, reservoirs, tides, floods and estuaries.
Each area of study is written in a speech bubble:
- Water volume changes
- River discharge
- Dynamics of estuaries
- Height of tides
- Hazards such as floods
- Prediction of marine conditions
- Near-surface ocean circulation
The title and subheading of the infographic are as follows: The SWOT mission – Surveying Earth surface water to help adapt to climate change and improve water management.
File size: 2.8 MB
Image size: 2400 x 1800 pixels
Resolution: 72 dpi
Useful link(s)
Copyright / Permission to reproduce
- Date modified: