
RADARSAT-2 images archives in North America
St-Paul-de-l'île-aux-Noix, Richelieu, Quebec - May 5, 2011
Location

Here is an image acquired on May 1, 2011 by Canadian satellite RADARSAT-2 showing the flooded areas around the Richelieu River. An image acquired a while ago allows us to visualize and appreciate the magnitude of the damage of the water overflow. The Canada Centre for Remote Sensing will produce flooding charts from these images and others to be acquired over the next few days.

St-Paul-de-l'île-aux-Noix, Richelieu, Quebec
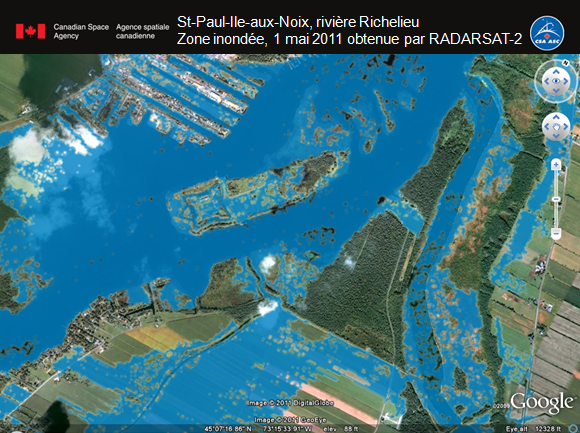
St-Paul-de-l'île-aux-Noix, Richelieu, Quebec, flood extent, May 1, 2011 acquired from RADARSAT-2
The flood extent products are derived from RADARSAT-2 images with a system developed and operated by the Earth Sciences Sector of Natural Resources Canada (RNCan). Flood extent boundaries © RNCan. RADARSAT-2 Data and Products © MacDonald, Dettwiler and Associates Ltd. (MDA) (2011) - All rights reserved. RADARSAT is an official mark of the Canadian Space Agency (CSA).
Disclaimer: These products are for demonstration purposes only. The CSA is not responsible for the accuracy, reliability or currency of the information or services provided by external sources.
Richelieu River floods – One year on
This animation produced from RADARSAT-2 data shows the maximum (in red) and minimum extent of the flooding in a portion of the basin of the Richelieu River in 2011. (Credits: MacDonald, Dettwiler and Associates Ltd. (MDA), NASA, Effigis Geosolutions Inc., Canadian Space Agency)
RADARSAT-2 data applications and utilizations providing support in the event of natural disasters
Minimum and maximum extents of a portion of the 2011 flooding
For a period of around 40 days between April and June 2011, heavy rain and the melting of a thick layer of snow in the area surrounding the Lake Champlain Basin and the Richelieu River caused water levels to rise substantially.
In Canada the floods affected approximately 3,000 principal residences in Quebec's Montérégie region. Municipalities primarily affected by the flooding include Venise en Québec, Noyan, Saint-Jean-sur-Richelieu, Henryville, Saint-Paul-de-l'Île-aux-Noix, Sainte-Anne-de-Sabrevois, Saint-Georges-de-Clarenceville and Saint-Armand. According to the Meteorological Service of Canada, the flooding was one of the most important meteorological events in Canada in 2011.
RADARSAT-2 images covering the period from April 11 to June 29, 2011, were used to develop products showing the extent of the flooding, thus providing support for Public Safety Canada's efforts in the field.
As part of a new disaster management initiative called Rapid Information Products and Services (RIPS), the (CSA)'s Earth Observation Applications and Utilizations Division worked closely with Public Safety Canada (PS) and Montreal firm Effigis Géo-Solutions to provide greater detail about the extent of the flooding, using Earth Observation data.
Earth Observation satellites such as RADARSAT-2 have become key resources when the need for more stringent flood management arises. The data are used to facilitate forecasting, intervention and the rehabilitation of affected areas.
Rights: RADARSAT-2 Data and Product© MDA (2012). All rights reserved. RADARSAT is an official mark of the CSA. Data from the EO-1/ALI image were made public by the U.S. Geological Survey and distributed by the Land Processes Distributed Active Archive Center (LP DAAC) located at USGS/EROS, Sioux Falls, South Dakota. Effigis Géo-Solutions, the CSA and Public Safety Canada cannot be held responsible for the contents or use of these products.
Disclaimer: These products are for demonstration purposes only. The CSA is not responsible for the accuracy, reliability or currency of the information or services provided by external sources.
Flooding in New Brunswick
Location
Recent rains and melting snow caused the Saint John River in New Brunswick to overflow its banks. Roads were closed and a number of buildings flooded. On April 30, in response to this emergency, Public Safety Canada (PS) activated the International Charter "Space and Major Disasters" to ensure continued satellite surveillance of the flooding.
The advanced capabilities of RADARSAT-2 were used for the first time in an emergency context, and provided superior information. Using RADARSAT-1 and RADARSAT-2 together, the authorities can continuously receive critical images daily. This combining of two Canadian satellites demonstrates the advantages and potential offered by a constellation of multiple sensors for monitoring a specific site in an emergency situation.
For more information, please see the Charter site.
- Region:
- New-Brunswick, Canada
- Sensor:
- RADARSAT-2
- Acquisition date:
- May 3, 2008, 22:12:50 UTC
- Mode and beam:
- S3, polarization HH and HV
- Orbit:
- 2020
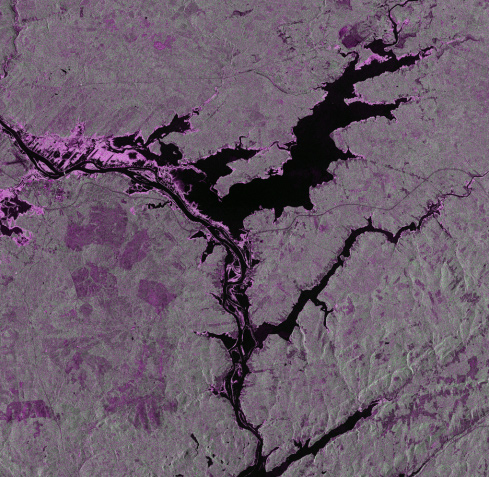
- Description:
- Completely flooded zones (river, lakes, etc.) are in black. The bright-toned areas indicate zones of flooded vegetation.
Credit: RADARSAT-2 Data and Products © MDA (2008) - All rights reserved.
- Region:
- New-Brunswick, Canada
- Sensor:
- RADARSAT-2
- Acquisition date:
- May 4, 2008, 10:23:09 UTC
- Mode and beam:
- S7, polarisation HH and HV
- Orbit:
- 2027
- Description:
- Completely flooded zones (river, lakes, etc.) are in black. The bright-toned areas indicate zones of flooded vegetation.
Credit: RADARSAT-2 Data and Products © MDA (2008) - All rights reserved.
- Region:
- New-Brunswick, Canada
- Sensor:
- RADARSAT-1
- Acquisition date:
- September 2, 22:22:18 UTC
- Mode and beam:
- S6
- Orbit:
- 56529
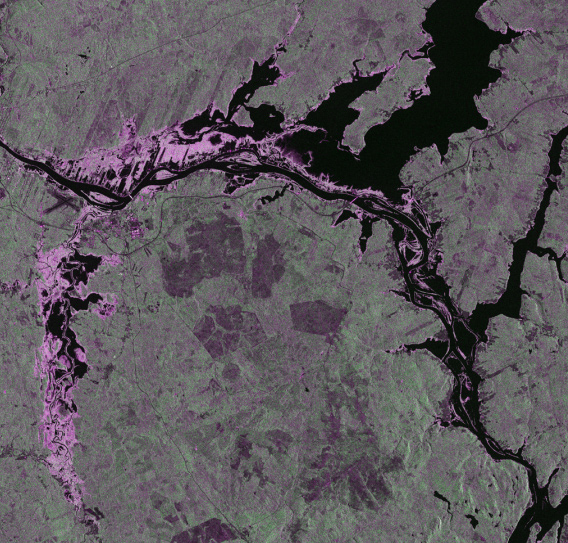
- Sensor:
- RADARSAT-1
- Acquisition date:
- May 5, 2008, 10:40:46 UTC
- Mode and beam:
- S1
- Orbit:
- 65254
- Description:
- The flooded zones appear red and pale blue; submerged ground is indicated in red, while partially submerged vegetation areas are in pale blue.
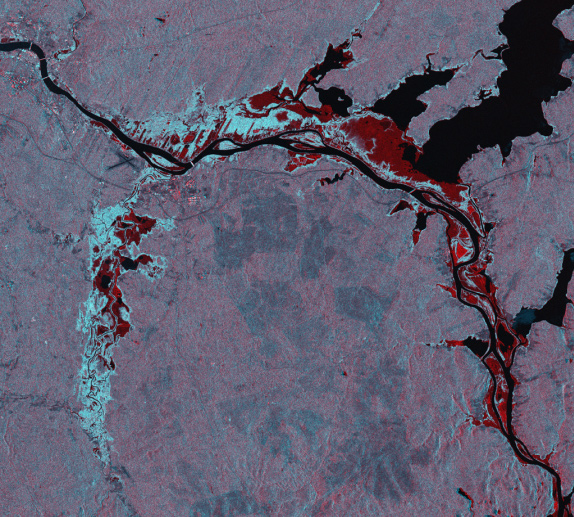
Credit: CSA (2008)
Text version of RADARSAT-2 image
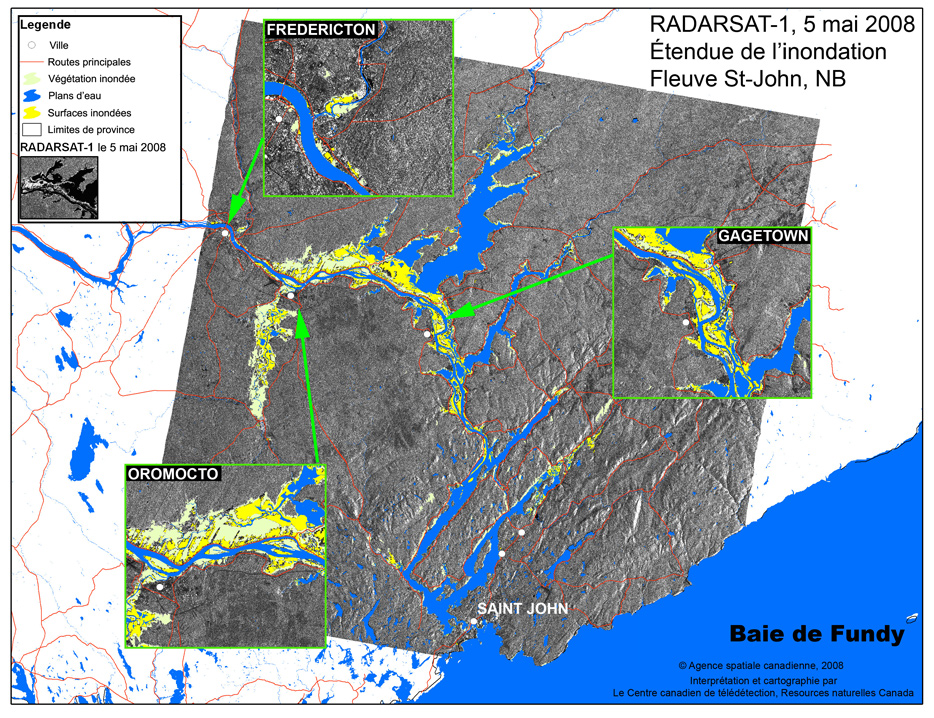
- Radarsat-1, May 5, 2008
- Flood extent extraction
- Saint John River Valley, New Brunswick (NB)
- Fredericton
- Gagetown
- Saint-John
- Oromocto
- Bay of Fundy
Interpretation and mapping by the Canada Centre for Remote Sensing, Natural Resources Canada (NRCan)
Credit: CSA
Central British Columbia Flood Activity - Highlights - June 30, 2012
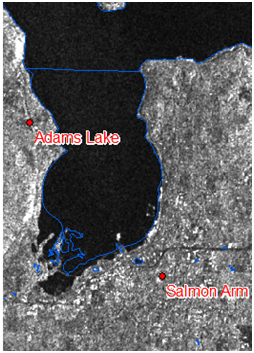
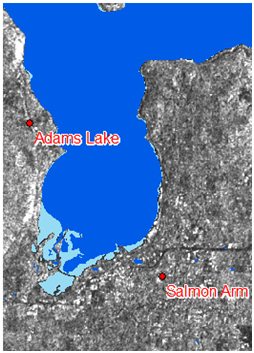
The June 30, 2012 (2:08 p.m. UTC) open water product derived from RADARSAT-2 shows flooding in Salmon's Arm bay area. On the left, the blue outline is the 50 km National Hydro Network overlaid on the RADARSAT-2 imagery. The dark areas represent areas of open water. On the right, the dark blue polygons represent the normal water level while the light blues represent the flood extent mapped from today's image.
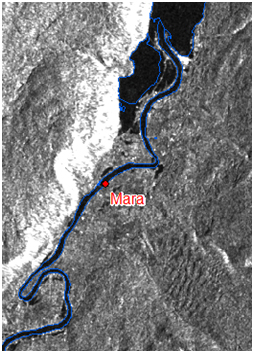
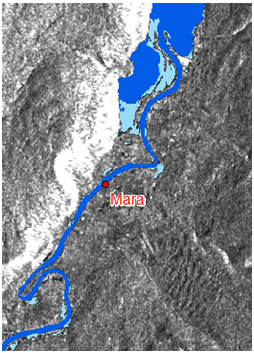
The June 30, 2012 (2:08 p.m. UTC) open water product derived from RADARSAT-2 shows flooding near Mara. On the left, the blue outline is the 50 km National Hydro Network overlaid on the RADARSAT-2 imagery. The dark areas represent areas of open water. On the right, the dark blue polygons represent the normal water level while the light blues represent the flood extent mapped from today's image.
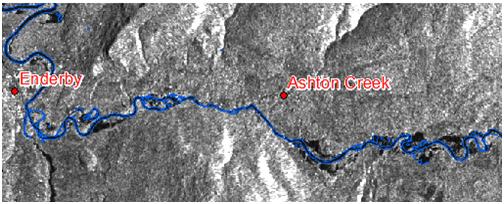
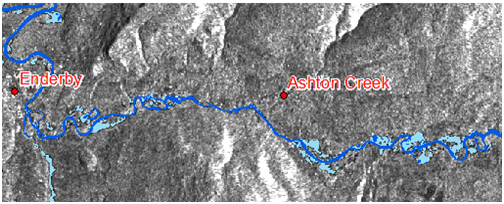
The June 30, 2012 (2:08 p.m. UTC) open water product derived from RADARSAT-2 shows flooding near Enderby. Above, the blue outline is the 50 km National Hydro Network overlaid on the RADARSAT-2 imagery. The dark areas represent areas of open water. Below, the dark blue polygons represent the normal water level while the light blues represent the flood extent mapped from today's image.
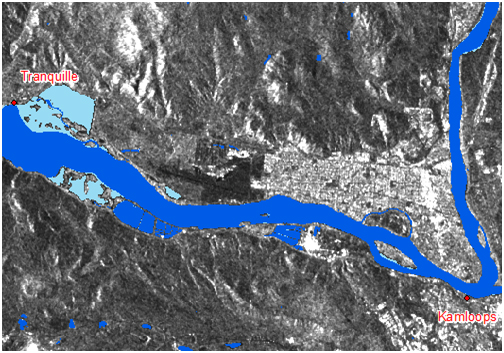
The June 30, 2012 (2:00 a.m. UTC) flood extent product derived from RADARSAT-2 shows flooding West of Kamloops area. The dark blue polygons represent the normal water level for this area while the light blues represent the flood extent mapped from today's image.
Flood of the river Fraser - June 27, 2012
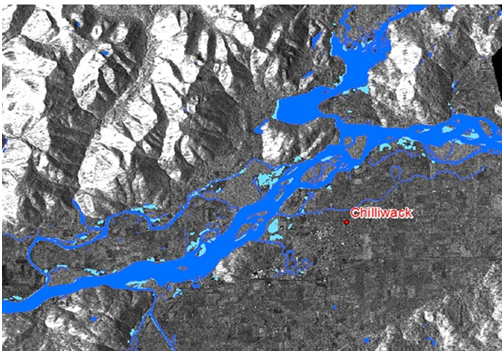
The June 27, 2012 (1:47 a.m. UTC) flood extent product derived from RADARSAT-2 shows flooding in the Chilliwack area along the Fraser River. The dark blue polygons represent the normal water level for this area while the light blues represent the flood extent mapped from today's image.
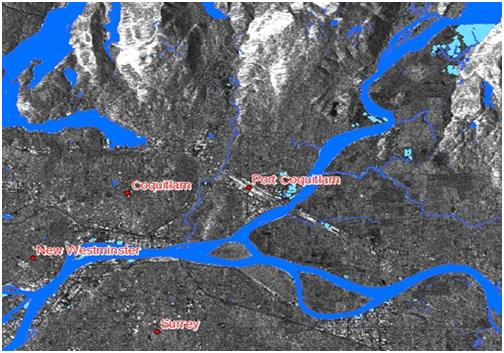
The June 27, 2012 (1:47 a.m. UTC) flood extent product derived from RADARSAT-2 shows flooding in the Port Coquitlam and New Westminster area along the Fraser River. The dark blue polygons represent the normal water level for this area while the light blues represent the flood extent mapped from today's image.
The International Charter "Space and Major Disasters" Activation #335, June 24, 2012
Rights: The flood extent products are derived from RADARSAT-2 images with a system developed and operated by the Earth Sciences Sector of Natural Resources Canada (NRCan). Flood extent boundaries © NRCan. RADARSAT-2 Data and Products © MDA (2012) - All rights reserved. RADARSAT is an official mark of the CSA.
Disclaimer: These products are for demonstration purposes only. The CSA is not responsible for the accuracy, reliability or currency of the information or services provided by external sources.
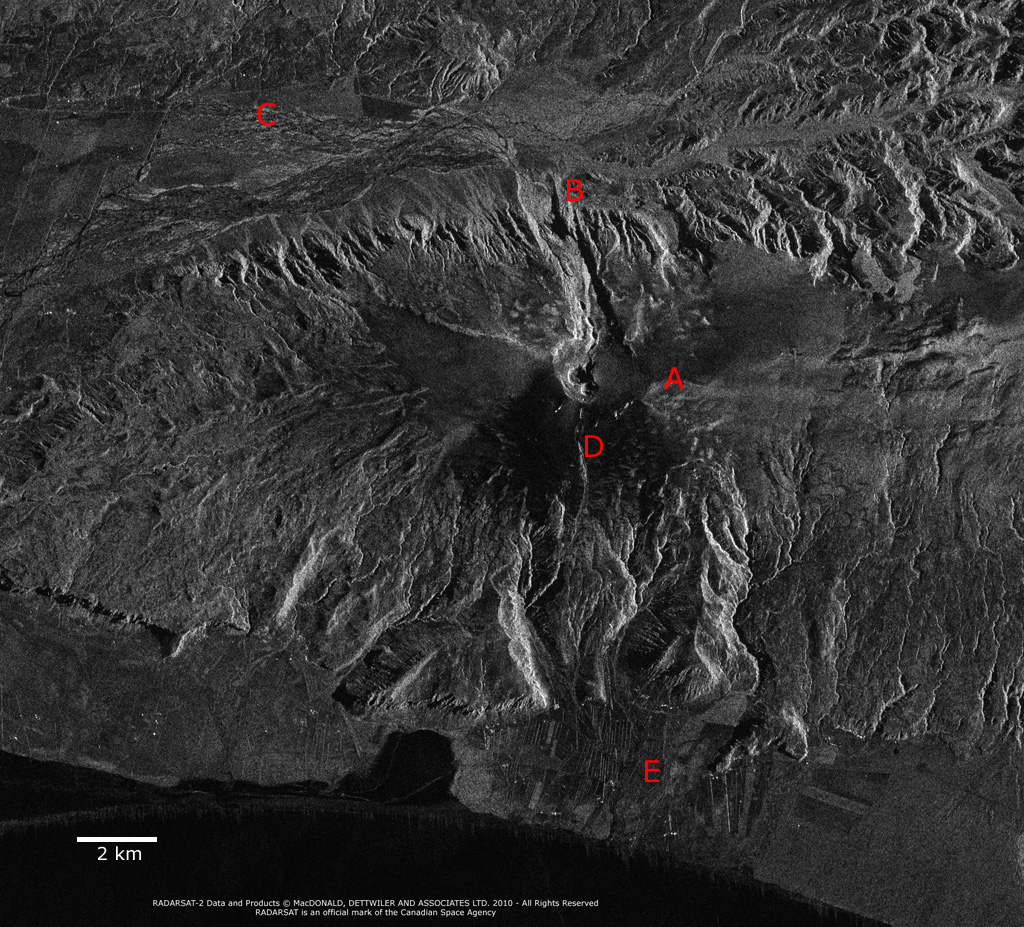
Eruption of the Eyjafjallajökull volcano in Iceland as seen by RADARSAT-2
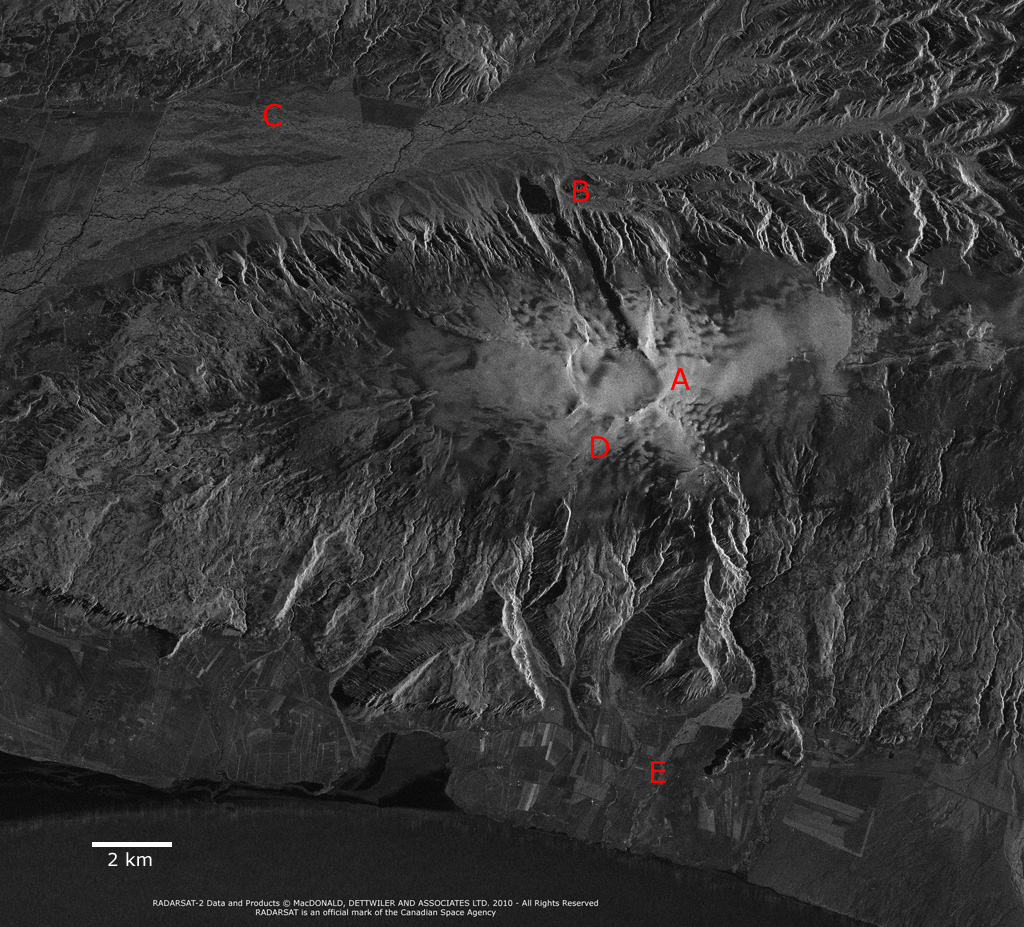
Here are two RADARSAT-2 images of the Eyjafjallajökull volcano acquired on April 9 and 20 2010. The first image was acquired before the eruption, the second, during the event. These images will be provided to the International Charter space and major disaster to help the civil protection services to better understand the situation.
Several observations can be made on the images:
- A : New volcano craters are evident on April 20th image
- B : The glacial lake on the north slope of the volcano is now filled with volcanic sediments
- C : The local drainage network is strongly affected by the melt water
- D : The radar backscatter has changed drastically, probably caused by the melted ice and by the presence of ash and dust on the ice
- E : Agricultural farms on the south slope of the volcano are now covered by ash and dust.
Note: The wavelength used by RADARSAT-2 is very weakly affected by the cloud of ash and dust.
- Region:
- Volcan Eyjafjallajökull, Island
- Sensor:
- RADARSAT-2
- Acquisition date:
- April 9, 2010, 07:34:48 UTC
- Mode and beam:
- Multi-Look Fine, beam 4
- Orbit:
- Descending
- Nominal resolution:
- 8 m
Credit: RADARSAT-2 Data and Products © MDA (2008) – All rights reserved. RADARSAT is an official mark of the CSA.
- Region:
- Volcan Eyjafjallajökull, Island
- Sensor:
- RADARSAT-2
- Acquisition date:
- April 20, 2010 à 07:13:53 UTC
- Mode and beam:
- Extended High, beam 4
- Orbit:
- Descending
- Nominal resolution:
- 25 m
Credit: RADARSAT-2 Data and Products © MDA (2008) – All rights reserved. RADARSAT is an official mark of the CSA.